If you’ve been following NFTs for a while you probably know that the space is dominated by generative mints where all items in the collection (usually profile pictures) are created through a predetermined, often pseudo-randomised process of combining different “layers” on one canvas.
Each NFT in such a collection is therefore defined by a combination of unique traits/attributes/properties that allow users to identify each specific piece. For example, your Avalanche Party Animal will have properties like fur colour, clothes type, earrings, etc.
Usually, the distribution of probabilities for getting a specific trait is heterogeneous (i.e., some of them have higher chances of appearing than others), so certain NFTs in the collection end up being rarer than the rest. In their paper “How rarity shapes NFT market” Mekacher et al. (2022) examine the market performance of pieces from 410 Ethereum collections based on their rarity.
Rarity distribution
To make comparisons between different collections possible the researchers first calculated normalised rarity scores for each NFT. This is done by summing up the rarity scores of each of its traits and mapping the result to a number between 0 and 100.
Having normalised rarity scores allows us to observe that not all collections are made the same in terms of rarity distributions. For example, for CryptoPunks the median rarity score (normalised) is 0.82 with the majority (99.7%) of tokens having a score lower than 10. BAYC and World of Women on the other hand are more homogenous (i.e., even, uniform) with median rarities of 20.3 and 14.8 respectively.
Less skewed rarity distributions would have been possible. The fact that projects opt-in for artificially heterogeneous ones could mean that there is a financial incentive to design collections like this.
For example, creators might specifically generate a few pieces with more than one rare trait instead of generating many common tokens with one rare trait. This makes some NFTs similar to lottery tickets, generating hype around rare and expensive tokens, therefore, attracting attention to the whole collection.
Market performance
Looking at the median sale price for the same three collections we can see that it is relatively flat for common NFTs but shoots up sharply when it comes to the rarest pieces.
This is further confirmed by examining all collections in the dataset. For the bottom 50%, the price is nearly the same, increasing almost threefold for 10% of the most scarce NFTs. The more than 500% jump in price between the bottom 90% and top 1% of NFTs in terms of rarity is even more striking.
Not only the rarest NFTs are drastically more expensive and sought after, but are also sold on average 8.3% times less often than the most common ones further contributing to their scarcity.
Return on investment
We already know that the rarest NFTs sell at a premium, but that doesn’t necessarily indicate that they should provide a higher return on investment.
However, examining 3,716,258 sales the researchers have found out that the median return when “flipping” (i.e., buying with the intention to sell at a higher price) rare NFTs is much higher compared to the return for the more ordinary ones. The return, in this case, is defined as a difference between the price of sale and the price of the purchase divided by the price of purchase.
The median return for the 50% most common NFTs sits at ~25% irrespective of their exact position in that bottom half, on the other hand, it increases by 95% in the top rarity decile.
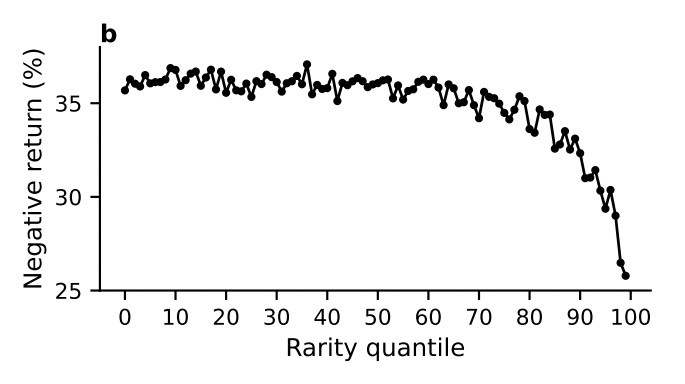
Moreover, the probability of making a loss drops by ~10% when dealing with the rarest pieces, as a share of sales that result in a negative return is 34 ± 0.58% for the bottom half and decreases to 29.1%-22.6% for the top 10%.
Conclusion
The key takeaway is that for an average investor, there is no huge difference in price and potential return between buying an average or more common NFT. In practice, that means that items from the bottom half of the collections, which are colloquially described as “floor” pieces, behave more like fungible tokens with very little difference in value between each other.
The top 10% and especially the top 1% of tokens in each collection on the other hand are actually non-fungible and provide on average much higher returns.
For more information about methodology, dataset information and analysis please refer to the full paper.


